The
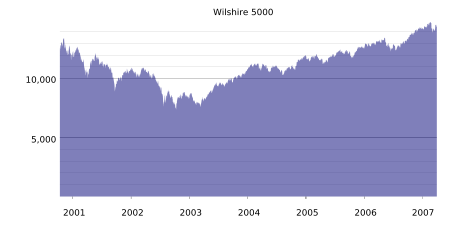
Wilshire 5000 from 2000 until Mar 30, 2007
The
Dow Jones Wilshire 5000 Composite Index, more simply
the Dow Jones Wilshire 5000, is a market capitalization-weighted
index of the market value of all stocks actively traded
in the USA.
Specifics
The index
is intended to measure the performance of all publicly traded
companies based in the United States having "readily available
price data." Hence the index includes nearly all common stocks, REITs, and limited partnership shares traded
primarily on the New York Stock Exchange, NASDAQ, or American Stock Exchange.
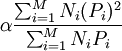
The price
of each issue included in the index is weighted by its relative
market capitalization. Let:
- M
= Number of issues included in the index;
- Pi
= Price of one share of issue i included in the index;
- Ni
= Number of shares of issue i.
- α
= a fixed scaling factor
The index
is then calculated as:
One index point corresponds to about US$1 billion. Hence the value
of the index, multiplied by one billion dollars, roughly equals
the total capitalization of the US stock market. Dow Jones publishes
two versions of the index, one based on full market capitalization
and another based on a float-adjusted market capitalization,
reflecting the number of shares actually available to trade.
The list of
issues is updated monthly to add new listings resulting from corporate
spin-offs and initial public offerings, and to remove issues which
move to the pink sheets or stop trading for ten days or more.
History
Wilshire Associates
began the index in 1974, naming it for the approximate number
of issues it included at the time. It was renamed the "Dow Jones
Wilshire 5000" in April 2004, after Dow Jones & Company assumed
responsibility for its calculation and maintenance.
The Wilshire
5000 did not close above its March 24, 2000 peak until February
20, 2007. A hypothetical investment in the Wilshire 5000, made
at the 2000 peak and with subsequent dividends reinvested, did
not become profitable on a closing basis until October 3, 2006.[1] On April 20, 2007, the index closed above 15,000 for the
first time. On that day, the S&P 500 was still several
percentage points below its March 2000 high. Since the turn of
the millennium, small cap issues absent from the S&P500 and
included in the Wilshire 5000 have slightly outperformed the large
cap issues that dominate the S&P 500.
External
links
|