|
The Nasdaq Composite is a stock market index of all
of the common stocks and similar securities (e.g. ADRs,
tracking stocks, limited partnership interests) listed on
the NASDAQ stock market, meaning that it has over 3,000
components. It is highly followed in the U.S. as an indicator
of the performance of stocks of technology companies and
growth companies.
Since
both U.S. and non-U.S. companies are listed on the NASDAQ
stock market, the index is not an exclusively U.S. index.
|
|
|
History
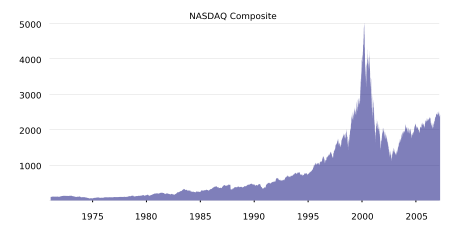
The NASDAQ
Composite from 1971 until today
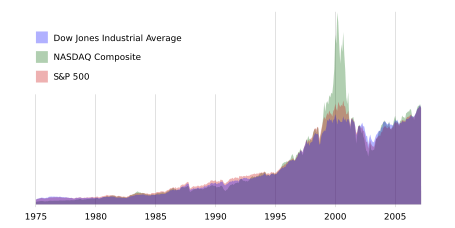
The NASDAQ
composite, shown here in green, has had larger swings than
other indices. Since the NASDAQ is heavy in tech companies,
the dot-com bust devastated it.
Launched in
1971 with a base value of 100 points, the Nasdaq Composite Index
is a broad based index which is calculated under a market capitalization
weighted methodology. To be eligible for inclusion in the Composite,
a security's U.S. listing must be exclusively on the NASDAQ Stock
Market (unless the security was dually listed on another U.S.
market prior to 2004 and has continuously maintained such listing),
and have a security type of either:
- American
Depositary Receipts (ADRs)
- Common
Stock
- Limited
Partnership Interests
- Ordinary
Shares
- Real Estate
Investment Trusts (REITs)
- Shares
of Beneficial Interest (SBIs)
- Tracking
Stocks
Closed-end
funds, convertible debentures, exchange traded funds, preferred
stocks, rights, warrants, units and other derivative securities
are not included. If at any time a component security no longer
meets the above criteria, the security becomes ineligible for
inclusion in the Composite Index and is removed.
On July 17,
1995, the index closed above the 1,000 mark for the first time.
The all-time low for the index had been reached in October 1974
around 54 points, representing a market drop of more than 45%
from the time of its introduction. On March 10, 2000, the index
peaked at an intra-day high of 5,132.52, and closed at an all-time
high of 5,046; the decline from this peak signaled the beginning
of the end of the dot-com stock market bubble. The index declined
to half its value within a year, and finally found a bear market
bottom on October 10, 2002 with an intra-day low of 1,108.49 after
a close of 1,114 the previous day. While the index gradually recovered
since then, it did not trade for more than half of its peak value
until May 2007. The index opened the fourth quarter of 2007 with
new 80-month highs, closing above the 2,800 point mark on October
9, 2007. The intraday level of 2,861.51 on October 31, 2007 was
the highest point reached on the index since January 24, 2001.
While increased anxiety over high energy prices and the possibility
of recession dropped the NASDAQ well into correction territory
in early 2008, a bear market was finally recognized on February
6th, 2008 when the NASDAQ closed below the 2,300 level, about
20% below the recent highs.
References
External
links
|